A lot of timber market discussion has been dedicated to our current tariff/trade talks with China, and how the impact of these talks has affected our eastern hardwood markets. As discussed multiple times in earlier stories, the Chinese demand for species such as black cherry and red oak had given a long-awaited shot in the arm to the price points for those two species, both of which had been in the top three of our typically most valuable hardwood species. At the current time, both these species have seen a decrease in demand from China and, consequently, prices paid for these species have fallen.
We should keep in mind though that one of the advantages of our hardwood market is that there are two geographic demand sectors; international and domestic. We’ve usually had the benefit of one positively offsetting the other in the past as either one may have dipped for a season or two. Over the last dozen years, as the global economy has gotten more integrated, we’ve seen several times when both markets have seemed to slip at the same time as economic problems would be more global in nature. However, the good news has always been that we do have these TWO markets, and even if both international and domestic markets are slow, the overall demand horizon is wide.
Despite the “Chinese Effect” we are currently seeing, we are still seeing decent international demand from other countries, and there have been a few promising domestic trends as well that may bode well for timber prices going forward.
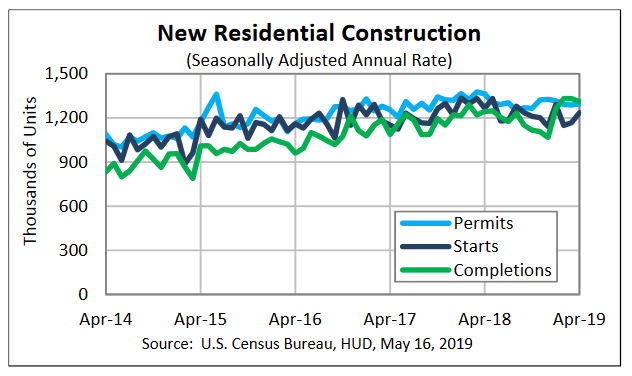
Domestic Housing Starts have long been a bellwether for general wood products demand; as new residential home construction increases so does the demand for framing lumber (usually with timber from our softwood areas in the south and west). Eventually, they will need to be finished and furnished with hardwood products, from flooring and molding to furniture and cabinets. And though consumer tastes cycle from dark woods to light woods and back, our operating regions in New York, Pennsylvania and West Virginia supply some of the world’s very best hardwoods that accommodate these product needs.
US Census Bureau Monthly Housing Starts
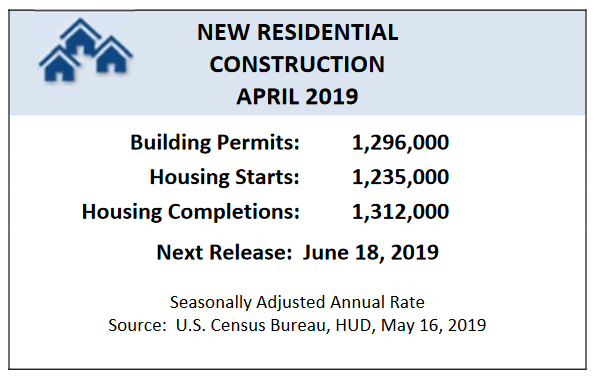
The US Census Bureau closely tracks the monthly movement of housing starts (and housing completions). Below are several short paragraphs summarizing their findings for the month of April 2019.
Housing Starts – National Overview
“Privately‐owned housing starts in April were at a seasonally adjusted annual rate of 1,235,000. This is 5.7 percent (±13.0 percent) above the revised March estimate of 1,168,000, but is 2.5 percent (±10.4 percent) below the April 2018 rate of 1,267,000. Single‐family housing starts in April were at a rate of 854,000; this is 6.2 percent (±13.7 percent) above the revised March figure of 804,000. The April rate for units in buildings with five units or more was 359,000.”

U.S. Census Bureau Residential Construction Statistics for April 2019
Housing Completions – National Overview
“Privately‐owned housing completions in April were at a seasonally adjusted annual rate of 1,312,000. This is 1.4 percent (±15.5 percent) below the revised March estimate of 1,331,000, but is 5.5 percent (±11.9 percent)* above the April 2018 rate of 1,244,000. Single‐family housing completions in April were at a rate of 918,000; this is 4.1 percent (±13.4 percent) below the revised March rate of 957,000. The April rate for units in buildings with five units or more was 381,000.”
(https://www.census.gov/construction/nrc/pdf/newresconst.pdf)

U.S. Department of Housing and Urban Development Residential Construction Statistics for April 2019
Housing Market Trends in New York
Also, when existing houses are sold, quite often the new owners replace existing circumstances with new floors or moldings or furniture or cabinets as well, also generating a significant demand for hardwood products. We thought it might be interesting to share with you a very short insight from the National Association of Realtors’ recent discussion about housing trends in New York.
As of May 21, 2019, they report that “with the typically robust spring season upon us, new listings increased 2.4 percent in April and 3.9 percent year to date, while pending sales rose 1.2 percent compared to this time last year across the Empire State, according to the housing market report released by the New York State Association of REALTORS®. There were 21,192 new listings and 12,835 pending sales in New York in April.
“Median sales prices continue to climb, escalating 6.3 percent to $271,000. This marks 40 consecutive months that the median sales price is up in a year over year comparison. Year to date, median home sales are up 6.3 percent.
“Despite a decline in closed sales from April of 2018, which fell 2.3 percent to 8,931 homes, decreasing mortgage rates are a good sign for home buyers. According to Freddie Mac, the 30-year fixed rate mortgage rate fell to 4.14 percent in April, its lowest rate since January 2018.
“Inventory continues to rise, increasing 1.1 percent to 64,531 homes for sale across the state. The month’s supply of homes for sale was up 3.6 percent compared to this time last year. In April, there was a 5.8 month supply of homes. A 6-month to 6.5-month supply is considered to be a balanced market that neither favors buyers or sellers.“ (New York State Association of REALTORS® and Showing Time Inc.)
In summary, housing sales are going well, and the housing supply trend looks like available housing is getting tighter, which may help increase current housing starts (new house construction).


